
The Campbell Institute: Safety leading indicators: A data science solution (part two)

The Campbell Institute at the National Safety Council is the EHS center of excellence. Built on the belief that EHS is at the core of business vitality, the Institute seeks to help organizations, of all sizes and sectors, achieve and sustain excellence. Learn more at thecampbellinstitute.org.
Using safety leading indicators that are NOT supported by data science validation is akin to using a lawn mower without a blade – a lot of noise but nothing really changes. And the noise may have a consequence. If the noise involves a rigorous senior leadership push to focus on unproven indicators, the associated shift of resources and attention may actually increase exposure and result in degraded outcome performance.
As mentioned in part one of this column, it is well known that senior leadership’s focus on lagging metrics is ineffective for driving better outcome performance. A focus on the “wrong” leading indicator is similarly unproductive. So, how can you find the “right” leading indicators to drive the organizational behaviors and conditions that result in better safety performance?
First, let’s define what we mean by the right leading indicators. If the desired outcome for safety leading indicators is to drive lagging performance, then the right leading indicators are BOTH:
- Statistically correlated to lagging safety performance
- Practically actionable (and believed by leaders) to affect outcome performance
You might construe part “a” to be the science and part “b” to be the art of successful leading indicators. An effective data science approach addresses these aspects as equally critical. The below methodology is designed to address these criteria.
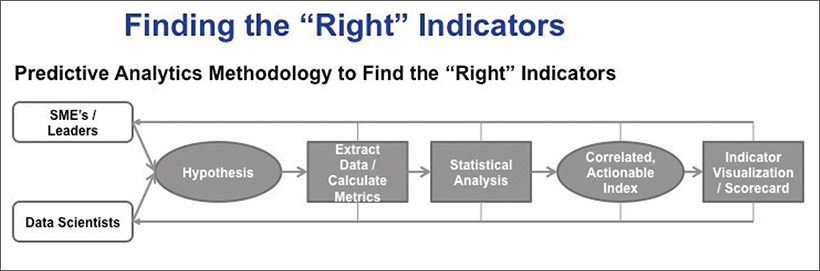
A predictive analytics initiative requires a hypothesis to define the relationship between the inputs (leading indicators) and the outcomes (lagging results). The data scientists ensure proper techniques are followed to test the hypothesis and reach a valid solution. The subject matter experts ensure the solution is practical, actionable and aligned with leadership beliefs to compel maximum uptake of the new balanced operational scorecard.
This analytics methodology has been deployed for a group of heavy industry (mostly energy and chemicals) companies, including data from thousands of operating facilities in more than 100 countries. These businesses use a similar information system for enabling the execution of risk reduction processes – incident/near-miss reporting, risk ranking, investigations, corrective actions, corporate audits, MOC, management system assessments, etc. This platform served as the source of data for applying the above methodology to identify the most effective safety leading indicators.
Workshops were conducted with a group of SMEs and data scientists to define the safety leading indicator hypothesis, which can be most effectively tested given the content of the source data. Per the expert participants, the overarching purpose of these risk processes is to tighten risk controls, mitigate exposures and ultimately reduce incident rates. Therefore, the hypothesis contends that level of risk process execution – denoted below as “risk process capability” – will yield level of risk exposure as well as higher or lower loss rates.
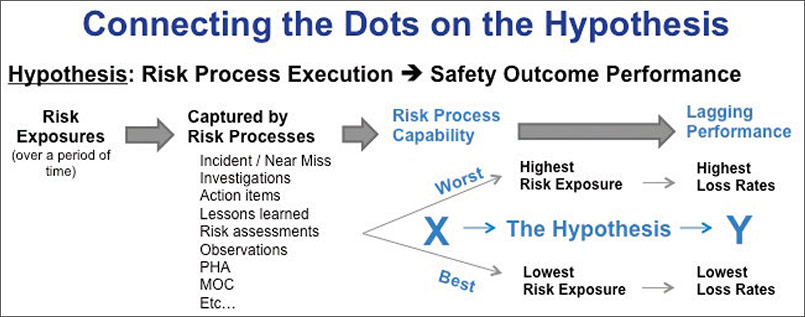
Testing this hypothesis is commensurate with identifying actionable measurements of risk process capability, which are predictive of safety incident loss rates. The analytics methodology has been exercised over several years with the aforementioned global data set of operating assets spanning varying levels of risk process maturity. The indicators reflected in the below diagram are collectively represented by a holistic leading indicator index, which was found for a group of higher-maturity assets to have a high correlation (r-squared ~.8) to safety outcome performance.

Organizations with the most mature risk process capability – process completeness, engagement and consistency – have the data availability and quality needed to measure all components of this index. A key learning from these studies involves the progressive, maturity-based nature of leading indicators.
An operating asset’s ability to measure risk process capability is progressively improved beginning with measurements of engagement, and then evolving through stages of process execution maturity from process discipline to risk driven to learning minded (as conveyed in the above diagram). At each level, data availability, quality and predictive ability of the resulting indicators are progressively improved.
Using this type of model, business leaders are able to shift away from the knee-jerk, lagging metric-based approach to traverse a leading indicator-driven roadmap for accelerating improvement of their risk processes, driving deeper engagement and more consistent execution, and ultimately strengthening risk process capability and reducing safety losses.
In short, they’re applying data science to the safety leading indicator problem. Or, in other words, they’ve installed blades on the lawn mower.
Post a comment to this article
Safety+Health welcomes comments that promote respectful dialogue. Please stay on topic. Comments that contain personal attacks, profanity or abusive language – or those aggressively promoting products or services – will be removed. We reserve the right to determine which comments violate our comment policy. (Anonymous comments are welcome; merely skip the “name” field in the comment box. An email address is required but will not be included with your comment.)